
Wind Turbine Diagnostics: Understanding the Drivetrain and ESA
 Keiichiro Nagaiwa
Reliable wind turbine diagnosis requires an understanding of the structure and mechanisms, linking phenomena from low to high frequencies to the way the equipment operates. This principle applies to both vibration analysis and Electrical Signature Analysis (ESA). This article outlines that approach and the measurement advantages of ESA.
Interpreting Frequencies through the Structure and Mechanisms
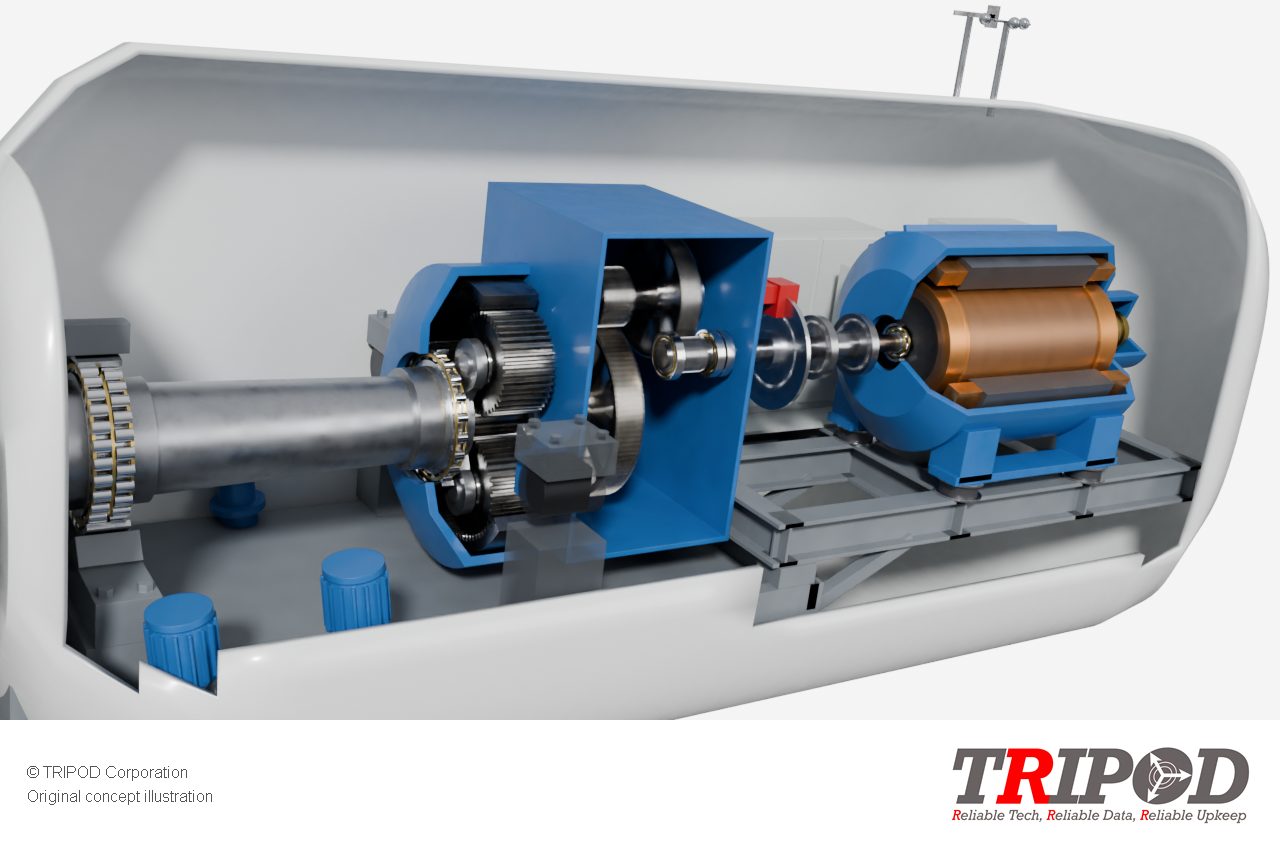
A wind turbine is a complex system comprising transformers, controls, generator rotor circuits and stator, a gearbox, main bearings, and a hub that holds variable-pitch blades. Geared turbines may use a two- or three-stage gearbox with planetary gearing, and one or two main bearings. The specific configuration varies by turbine design.
Relevant frequencies range from slow variations associated with the rotation of the main shaft and blades to components associated with gear meshing and the generator.
Example: A Blade-Side Rotor Speed of 19 rpm
For a three-bladed turbine, the reference frequencies associated with rotational orders are as follows.
| Component | Calculation | Frequency |
|---|---|---|
| Rotational frequency (1P) | 19 ÷ 60 | Approximately 0.317 Hz |
| Second rotational order (2P) | 2 × 19 ÷ 60 | Approximately 0.633 Hz |
| Blade-passing frequency (3P) | 3 × 19 ÷ 60 | 0.950 Hz |
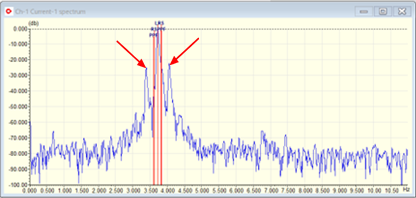
The table shows frequencies corresponding to mechanical rotational orders. In ESA current and voltage spectra, these variations may appear as sidebands around the supply frequency, with components on either side of a central frequency.
These figures are calculated examples based on the stated conditions. The presence of any of these components alone does not indicate a blade fault.
The ESA Advantage: Assessing the Drivetrain from One Measurement Location
Wind turbine vibration analysis generally uses sensors at several locations, such as the main bearings, gearbox and generator, to capture vibration at each component.
ESA measures current and voltage at one location, such as a control panel where suitable signals can be acquired, to assess both the generator and the wider drivetrain, including the blades, main shaft and gearbox. Changes in component condition can produce torque variations that are also reflected in the electrical signals.
Selecting Measurement Conditions to Distinguish the Phenomena
Closely spaced components from different phenomena can lead to incorrect conclusions about the location or cause of an anomaly. Rather than relying on the analyser’s maximum frequency (FMAX) or FFT point count alone, we check whether the actual analysis bandwidth and frequency resolution are sufficient for the diagnostic target.
The actual recording duration, window function, noise and rotational speed variation also affect the ability to distinguish components. Measurement conditions must therefore be selected for the phenomena of interest.
The information available also depends on the measurement location and power converter configuration. We establish the scope of assessment by checking the equipment structure against the measured rotational speed and supply frequency.
Separating Operating Variations from Signs of Anomalies
Changes in speed and load caused by wind conditions and control actions also affect the spectrum. Waterfall displays arrange spectra in time order, allowing us to examine how components move and recur.
We compare these features with wind conditions and SCADA operating data to assess drivetrain health from the blades to the generator. Where needed, we also use vibration analysis and inspection findings to support decisions on further inspection and maintenance.
For application conditions and the diagnostic process, seeWind Turbine Diagnostics and Condition Monitoring (Japanese). For the underlying principles, seeWind Energy Applications of ESA. You can alsocontact us about diagnostics and analysis.
Reference
Howard W. Penrose, Practical Electrical and Current Signature Analysis of Electrical Machinery and Systems.